
Lead prioritization is not a new concept. Businesses use CRM and other platforms to manage and prioritize their leads for faster conversions and better deal size. What has worked until now is to prioritize leads based on ICP (Ideal Customer Profile) and Degree of Intent, which is essential but insufficient. We take it a step further by introducing location data and affluence lead score to the process.
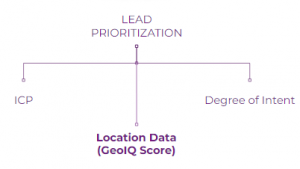 Pillars of Lead Prioritization
Location data is a great indicator of user affluence. One can draw a lot of intelligence and insights about user affluence and behavior by simply studying the location attributes of their presence. The affluence score that we calculate is an aggregate of multiple location attributes, some of which are average rentals, population density, presence of brands, average meal cost for two, household income, historical pattern, and more.
When you augment the existing model for lead prioritization with location data and intelligence, you are able to shrink your final funnel of warm leads to a smaller pool of hot leads. The result is in terms of increased conversions by reducing effort and time consumption.
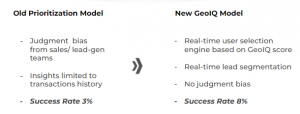 A New improved model augmented with location data
Methodology of Attaining a lead score
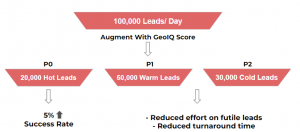
When you have a large number of leads coming in every day, it is practically impossible to pursue each of them. It is also not necessary to pursue all of them as a considerable percentage of these leads are junk.
Even among the good leads, a considerable number of leads would be cold, where there is no intent or the lead does not fall in the ICP bucket. But what beyond that? For the leads that have intent or fall under the ICP category, the user might not have the spending capacity for the service/ product.
Here, affluence plays a key role, which could be quantified by considering location attributes. The true hot leads are the ones that are filtered through affluence lead score.
How is Affluence Lead Score Calculated?
Here’s the process to calculate user affluence in simple pointers:
- Our no-code ML model takes the addresses of the older leads. That have converted or not converted as input and identify locations where these users are present
- It then studies the characteristics/ attributes of these locations or catchments to identify affluence indicators
- The location attributes identified for users that converted are the positive indicators and similarly, the location attributes identified with the users that did not convert are negative indicators
- Location attributes to calculate affluence scores could be different for different businesses. It can be based on their products, target groups, use cases, and other factors
- In the case of a fintech brand we worked with, some of the key affluence indicators were identified to be average rentals, population density, presence of brands, average meal cost for two, household income, and presence of tertiary roads, among others
- Once model learning is complete, based on the attributes finalized for affluence prediction, the model will start assigning scores to all the new leads
Outcome
For one of our fintech clients, we achieved a 5% uptick in success rate, by prioritizing their leads considering affluence. Moreover, the time and effort wasted on futile leads were considerably saved, in turn reducing the turnaround time of conversions.
Conclusion
A location tells a lot about user behavior and affluence. When businesses harness this data and draw insights for prioritizing. They could benefit in terms of improving the accuracy of affluence prediction, success rate, leads’ conversion rate, and turn-around time.
Again, affluence is a key parameter when it comes to lead prioritization and it takes the whole process a notch higher.
Visit GeoIQ to know more about how lead score can help in lead prioritization.