
Overview
This report presents a comprehensive healthcare index covering districts across India, designed to provide valuable insights into the state of healthcare nationwide. By analyzing a diverse range of factors—including population and household profiles, Quality of family planning services, and delivery care—we aim to highlight both strengths and opportunities within India’s healthcare system.
The healthcare index assigns a score to each district, reflecting the quality of its healthcare conditions in comparison to others, offering a clear benchmark for evaluating healthcare performance across the country.
Introduction
The state of healthcare is critical to everyone’s well-being, the advancement of society, and the country’s development. Not only is access to high-quality healthcare a fundamental right guaranteed by the nation’s constitution, but it also promotes social justice, economic growth, and personal flourishing. The healthcare sector is essential to protecting the health and dignity of India’s diverse population, from combating infectious diseases to addressing the burden of non-communicable diseases.
Using data from the National Family Health Survey (NFHS), a centerpiece of public health research in the country, this report explores India’s healthcare landscape.
The NFHS is conducted periodically to provide insights into the socio-economic variables, demographic trends, and essential health indicators that influence community health.
About Data
The National Family Health Survey (NFHS) is a large-scale, multi-round survey conducted in a representative sample of households throughout India. We used the appropriate indicators (insert numbers) related to healthcare in the NFHS-5 Report released by the Government of India. The indicators were then further categorized to eight categories namely – Population and Household Profile, Quality of Family Planning Services, Characteristics of Women (age 15-49 years), Delivery Care (for births in the 5 years before the survey), Child Vaccinations and Vitamin A Supplementation, Child Feeding Practices and Nutritional Status of Children, Nutritional Status of Women (age 15-49 years), Anaemia among Children and Women, Hypertension among Adults (age 15 years and above).
Methodology – Math and Mechanisms
Step 1 – Isometric Log Ratio Transformation
In statistical analysis, it is common to have outliers that can affect the outcome significantly. Also, a higher value of ‘Children under 5 years who are stunted’ in a district is not good for the healthcare index but a higher value of ‘Children aged 12-23 months who have received 3 doses of polio vaccine’ is desirable for the healthcare index.
So to deal with outliers and make all the variables positively correlated to the index, Isometric Log Ratio Transformation was done on each indicator.
Isometric Log Ratio Transformation (ILR) works on compositional data. Hence, all the variables were divided into two parts – positively and negatively correlated parts of the variables, and the following transformation was carried out for each district and corresponding to each indicator.
x = (1/√2)*log(positively correlated part/negatively correlated part)
All indicator values are percentages, so they can be composed into two parts: x, 100 – x; where x = the indicator’s value. Based on the variable, we have decided which is the positively correlated part and which is negatively correlated.
For example, 100 – x would be the positively correlated part for ‘Children under 5 years who are stunted’ and x would be negatively correlated whereas it would be the other way round for ‘Children aged 12-23 months who have received 3 doses of polio vaccine’.
Step 2 – Principal Component Analysis
Principal Component Analysis (PCA) is an unsupervised learning algorithm used to reduce the number of features for a dataset that contains a large number of features while capturing enough information about the sample. It helps data scientists visualize the data, to figure out what might be going on.
The algorithm creates a new set of variables called Principal Components (PCs) which are linear combinations of the initial variables (here they are indicators) in such a way that most of the information/variance is captured in the first (major) PCs. The number of PCs to be considered depends on the variance that needs to be captured out of the initial information.
So, if there are n variables, the number of PCs can be n, but the information contained in them decreases from firsts to the lasts as shown in the scree plot below which depicts the amount of variance each PC captures.
For example, the category ‘Population and Household Profile’ has 10 indicators but after
PCA, only 6 PCs have been considered.
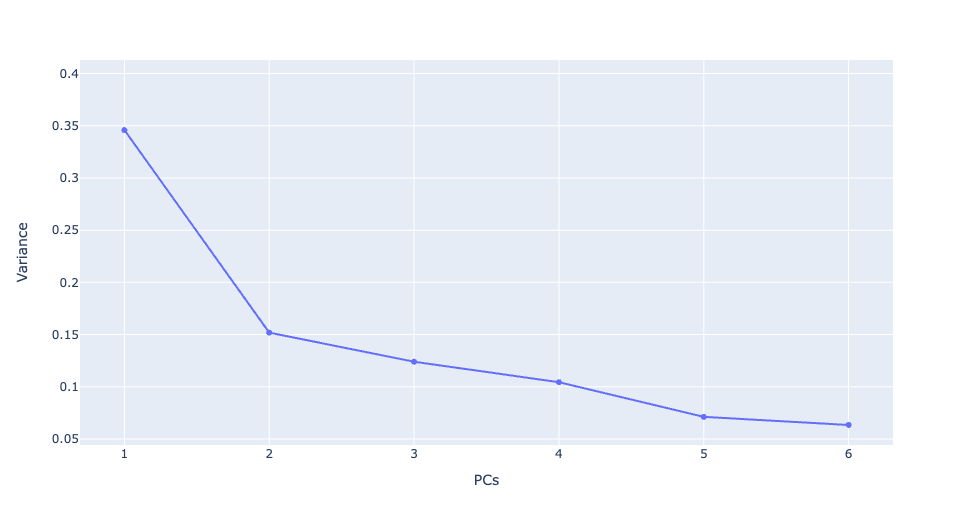
- Proportion of Variance Explained : [0.3459571 0.15184378 0.12396498 0.10433747 0.07114614 0.06334852]
- Cumulative Proportion of Variance Explained: [0.3459571 0.49780088 0.62176586 0.72610333 0.79724947 0.86059799]
- No of Total Initial Variables: 10
- No of PCs important: 6
For the index, we have considered enough PCs that can capture at least 80% of the variance in the initial data for each of the eight categories.
Step 3 – Weighted Index Calculation
The weighted index for each category is calculated using the derived PCs which are a representation of the original values in each category and the corresponding variance that they capture, which means
Wi =j=1j=nPCi,j* Vari,j
Here, the variance of the corresponding category plays the role of weight, PC which has captured higher variance is given more weight.
Step 4 – Jenks Optimization
The Jenks optimization method is a type of data clustering technique that arranges values into different classes in such a way that the average deviation for a group from its mean is minimized, while the deviation from the other class’ mean is maximized. In simpler words, it minimizes the variance within a range.
After calculating a weighted index for each category, the membership score for each category is calculated which would have values from 1 to 5 (very bad to very good). For these scores, Jenks natural breaks optimization was used to classify the weighted index calculated for each category into the 5 classes.
Step 5 – Calculate Final Score
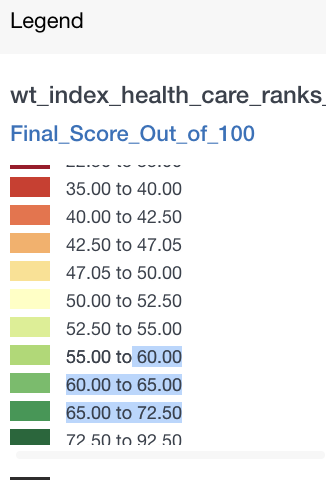
The final score for each district is the sum of the scores in all of the categories (varying between 1 to 5) divided by the maximum score possible (40 in our case, 5 in each category) and then normalized between 1 to 100.
Conclusion and Key Takeaways
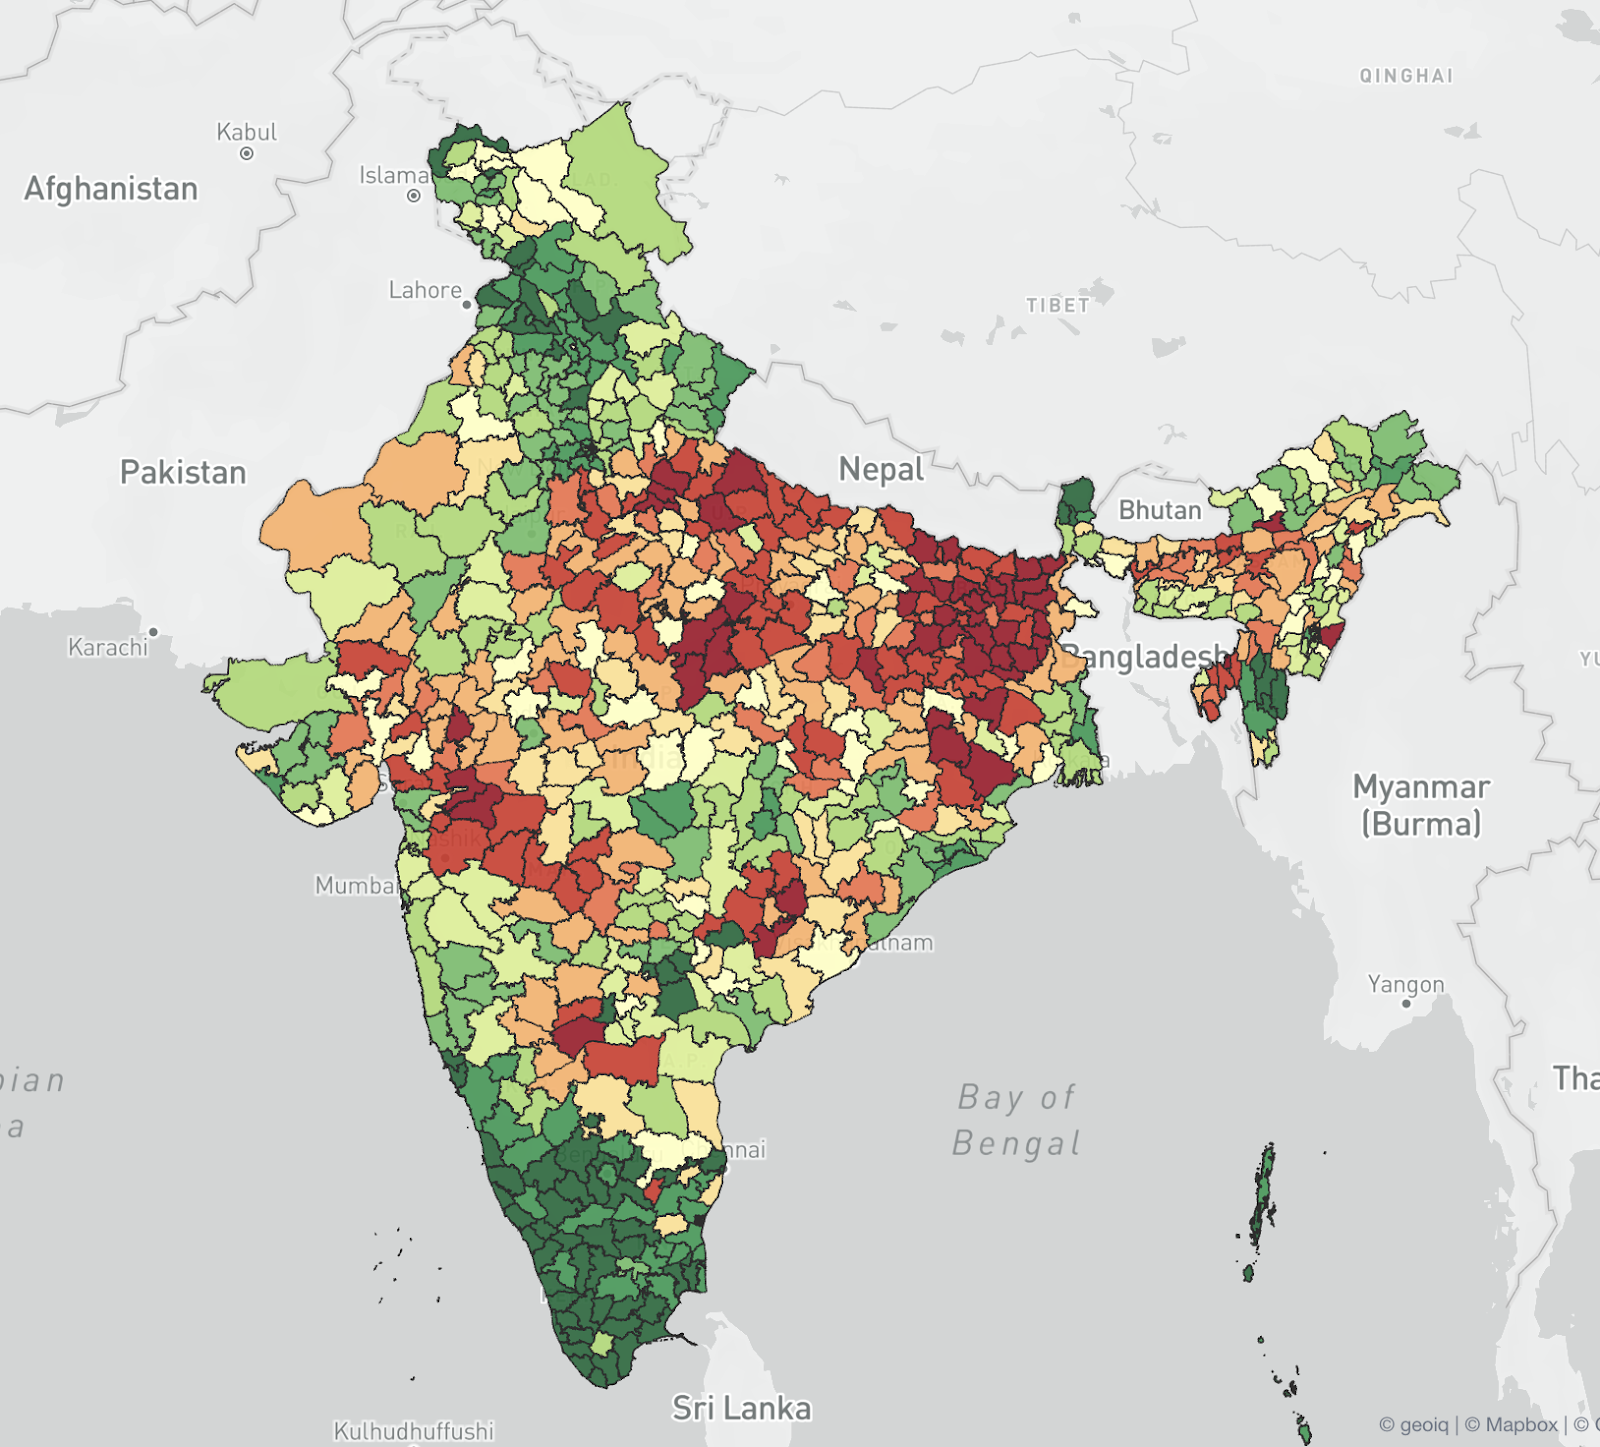
Districts scored based on health index: we can see that the southern districts have higher health scores as contrasted with the majority districts of Bihar and UP, and some districts of West Bengal and Madhya Pradesh.
- Out of the 27 districts that have the best healthcare, only two of them are in Northern India (both in Punjab), 1 in Andaman and Nicobar Islands, and the remaining 24 districts belong to the states of Kerala, Tamil Nadu, Karnataka and Goa.
- Kerala is the only state where all districts have good or very good healthcare, while Andhra Pradesh is the only southern state where no districts have good or very good healthcare.
- Only 1 district each from the states of Gujarat, Manipur, and Arunachal Pradesh, only 2 districts each from the states of Odisha, Chhattisgarh, and West Bengal, and only 3 districts from Maharashtra have good or very good healthcare.
- No districts from the states of Assam, Bihar, Jharkhand, Madhya Pradesh, Uttar Pradesh, and Rajasthan have good or very good healthcare
- This shows that districts that have good or very good healthcare are limited to a few pockets in the country.
- The Northern and Southern extremes of India have better healthcare conditions than their counterparts.
- It comes as no surprise that most of the districts have moderate, bad, or very bad healthcare conditions. Out of 732 districts being considered, 584 districts have moderate or below moderate healthcare conditions.
- 31 out of 32 districts considered in Assam, all of the 38 districts considered in Bihar, 61 of the 75 districts considered in Uttar Pradesh, 23 of the 24 districts considered in Jharkhand, 45 of the 52 districts considered in Madhya Pradesh have bad or very bad healthcare conditions.
- The only district in southern India which has very bad healthcare is the Raichur district of Karnataka.
References:
- Identification of backward district in India by applying the principal component analysis and fuzzy approach: A census-based study – by Tirthankar Basu and Arijit Das

