
Affluence Index
A measure of prosperity in a selected catchment area. The measure of affluence is relative to the established retail brand. The definition of affluence for a luxury brand is different from the difference of the same for a value-fashion brand.
Accessibility
The ease with which a customer can reach the store. The distance between the store and an access road measures accessibility. Accessibility also depends on public transportation, for example, a metro station, bus station, or train station.
Cannibalization
Cannibalization is a phenomenon where new stores from a retail brand encroach on the territory of an existing one, thereby reducing its revenue. This leads to diminished profits for the brand, as resources are diverted to support multiple stores instead of just one.
Catchment Area
A catchment area is a geographic region surrounding an address, locality, or lat-long, where a brand attracts a population using its services. Analyzing this area helps retail brands grasp their customer demographics, assess competition, recognize complementary brands, estimate revenue potential, and evaluate the risk of cannibalization.
Catchment Size (Walk time/ Drive time)
Catchment size is a metric measuring the catchment area based on the walk time or the drive time from a selected location; the values are based on the availability of navigable roads.
Competition Mapping
Competition mapping is a strategic analysis aimed at:
- Assess the presence of competing brands within the trade area/ target market.
- Understanding the performance of these competing brands in the said area
- Understanding what factors contribute to the success or failure of these brands in the said area
- Analysing customer characteristics that these brands serve
By identifying performance, opportunities, and areas for improvement based on competitor analysis, businesses can refine their offerings and position themselves more effectively against them.
Ultimately, competition mapping aims to devise a comprehensive revenue-generation strategy that enables the retail business to seize a larger market share.
Competitor and Complementary Brands
Brands that share the same target audience with a retail brand. The presence of these brands indicates the presence of a target audience in the selected catchment area.
While competitor brands compete for sales from the retail brand, a complementary seeks to help increase the revenue of the retail brand with its presence.
Crowd Pullers
Crowd pullers are people magnets present in a catchment area. Their presence indicates bustling activity and high potential footfall in the chosen catchment.
For example, a crowd-puller could be as simple as a restaurant consistently drawing in customers for years.
Data Variables/ Attributes
At GeoIQ, we use over 3,500+ data attributes mapped to specific features of an area to build a comprehensive overview of the site location. These attributes include the age of customers, price of meal for two, distance from a bus/railway/metro station, and presence of a major thoroughfare, among many others. Each piece of information for a specific location is a data variable.
Footfall
Footfall or foot traffic measures the number of customers entering a store in a selected timeframe. Retailers leverage data derived from footfall estimation to determine strategies to improve sales, customer retention, and merchandise mix, among many other factors.
GeoIQ Explorer
The GeoIQ explorer is an easily configurable analytic tool that empowers retailers to comprehensively analyze a site location. GeoIQ Explorer leverages the 3,500+ data attributes mapped by GeoIQ to provide retailers with a granular overview of the selected location.
Growth Trends
The overall trajectory of retail real estate in a specific catchment area. Positive growth trends signify an uptick in new retail openings nearby. Deciphering growth trends can be complex; for instance, locales like Khan Market may exhibit sluggish growth due to infrequent new retail additions.
Location AI
A robust machine learning model trained on over 3,500 data variables. The Retail Analytics AI of GeoIQ removes the reliance on gut-based decisions, reducing the time taken to reach the break-even period.
Location Data
Location data contains information defining any location’s physical and geographical features. From the pin code to the area’s population density, location data encompasses the entirety of an area.
Over Expansion
Overexpansion is where rapid retail growth drains operational capital, reducing resources for essential functions like restocking inventory, payroll, and operating expenses, often resulting in in-store or brand closures.
Other effects of over-expansion are cannibalization and losses due to mindless selection of multiple locations that do not promise much revenue.
Point of Interest
A physical location that is represented by a latitude and longitude. Examples include a bank, a hospital, a retail store, historic monuments, parks, etc.
RetailIQ
RetailIQ is a cutting-edge AI solution revolutionizing offline expansion for the retail section. It is built on top of extensive location data and brand data to give street-level answers to expansion problems.
RetailIQ is a powerful tool providing site recommendations to maximize success at the store level and minimize the risk of closure. It also helps identify the total addressable market, conduct competition analysis, better understand your target audience traits and their presence, and perform detailed site analysis and reports, all adding up to a successful expansion strategy.
Retail Clustering
Retail clustering strategically places competitor brands near each other within a catchment area to capitalize on shared target audiences. This phenomenon is a visible sign of potential market presence and is a crucial consideration for expansion decisions.
Revenue Score
A GeoIQ score that estimates the revenue that can be generated in a particular catchment area.
Site Recommendations
RetailIQ’s intuitive model provides retailers with a list of site locations that looks like its existing successful store locations.
Site Report
A comprehensive evaluation of the factors responsible for the success of a retail store in a selected location. Site reports provide a retailer with all the necessary information related to the success of the retail brand.
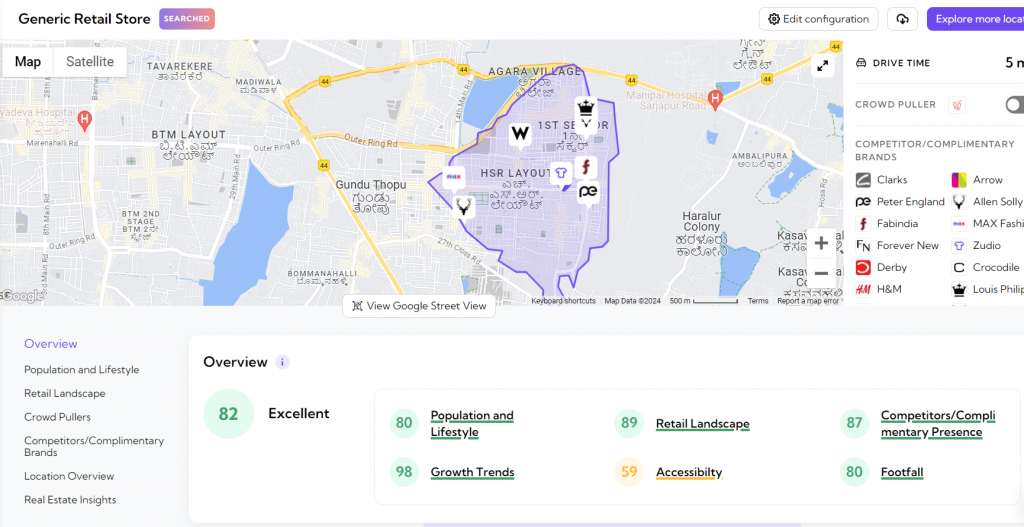
Representative image of RetailIQ’s site report for a generic retail store with the values for the factors measuring the success of a location.
Parts of the Site Report
Population and lifestyle: A target audience is customers meeting specific industry-defined parameters. These parameters are demographics linked to living standards and established differentiators.
Retail Landscape: This variable measures the retail diversity in a selected catchment area.
Competitors/Complimentary Presence: This factor measures the presence of competitors or complementary brands in the selected catchment area. A competitor brand shares a similar target audience with the retail brand and competes for revenue.
Growth Trends: The growth trend indicates the net change in new store openings within the chosen catchment area. A positive trend occurs when openings surpass closures, while a negative trend arises when closures outnumber openings.
Accessibility: This factor gauges the ease with which customers can reach a store, considering the range of transportation options available.
Footfall: Footfall or foot traffic measures the number of customers entering a store in a selected timeframe. Retailers leverage data derived from footfall estimation to determine strategies to improve sales, customer retention, and merchandise mix, among many other factors.
Site Score
GeoIQ’s custom-built AI models grade properties in a city using our custom score. Site scores help retailers determine a selected location’s probability of generating profits.
Street-level Insights
Retailers who employ GeoIQ’s custom AI solutions receive a granular perspective of their prospective site location. These insights enable retailers to make data-oriented expansion decisions.
Total Addressable Market
TAM, or Total Addressable Market, represents the revenue potential within a specific catchment area if a retail store captures 100% of the market demand. It’s pivotal for guiding business expansion strategies and pinpointing lucrative markets.
Precise TAM assessments facilitate accurate revenue forecasts and reveal gaps in competitors’ retail strategies.
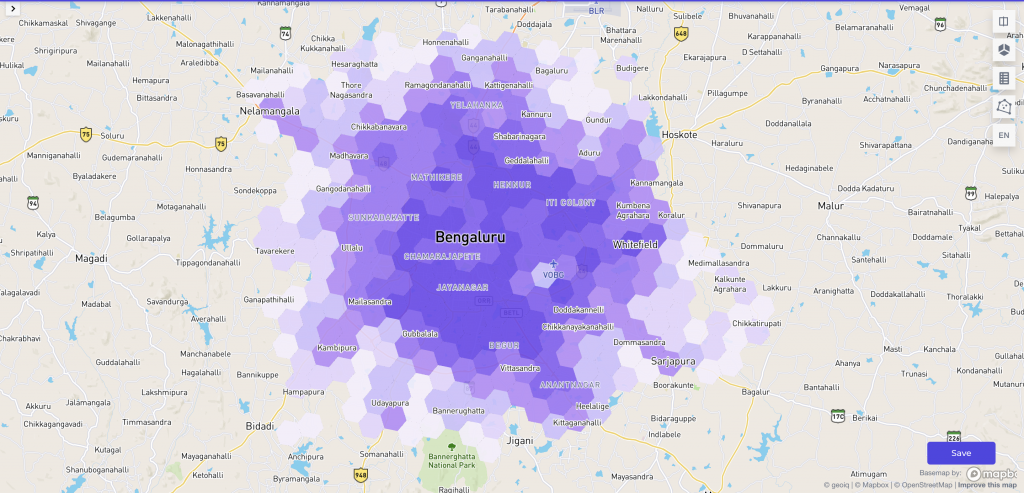
A representative TAM map of a fictitious retail brand
Whitespace Analysis
Whitespace analysis is an analytics method retail stores adopt to identify profitable locations based on existing data.

