One of the largest Quick Services Restaurant chains sought data-backed insights to identify ideal locations for their new stores. With 800+ existing stores, the client aimed to leverage GeoIQ’s location AI solutions to analyze performance indicators and predict high-revenue locations.
About the Client
A renowned global leader in the quick-service and fast-food restaurant industry, that operates in over 100 countries and serves millions of customers daily. Our client’s location strategy lies in opening stores in high-traffic, high-potential zones. As of December 2024, the brand has 848 stores across India.
The Challenge
- Accurately forecast the potential number of transactions for both dine-in and online channels on a daily basis.
- Scout and identify potential markets in the city list provided by the client.
- Pinpoint specific street-level locations to maximise profitability and minimise risk.
The Outcome
With custom machine-learning models powered by GeoIQ’s location data, the brand successfully shortlisted 50+ high-potential sites for their next set of stores across India.
Methodology
Effective site selection requires a deep understanding of the target locations, particularly their demographics.
To help the brand shortlist high-revenue potential locations, we built separate machine learning models for both online and offline channels.
The revenue model we built is designed to forecast the revenue range the brand can expect for both channels based on the success-defining variables (KPIs) in a target location, which will be listed later on.
The machine learning model we built will:
- Train on the existing data from the stores,
- Identify possible factors that contribute to a store’s success, and
- Replicate the success factors across new & potential locations to predict their revenue potential and suitability for expansion.
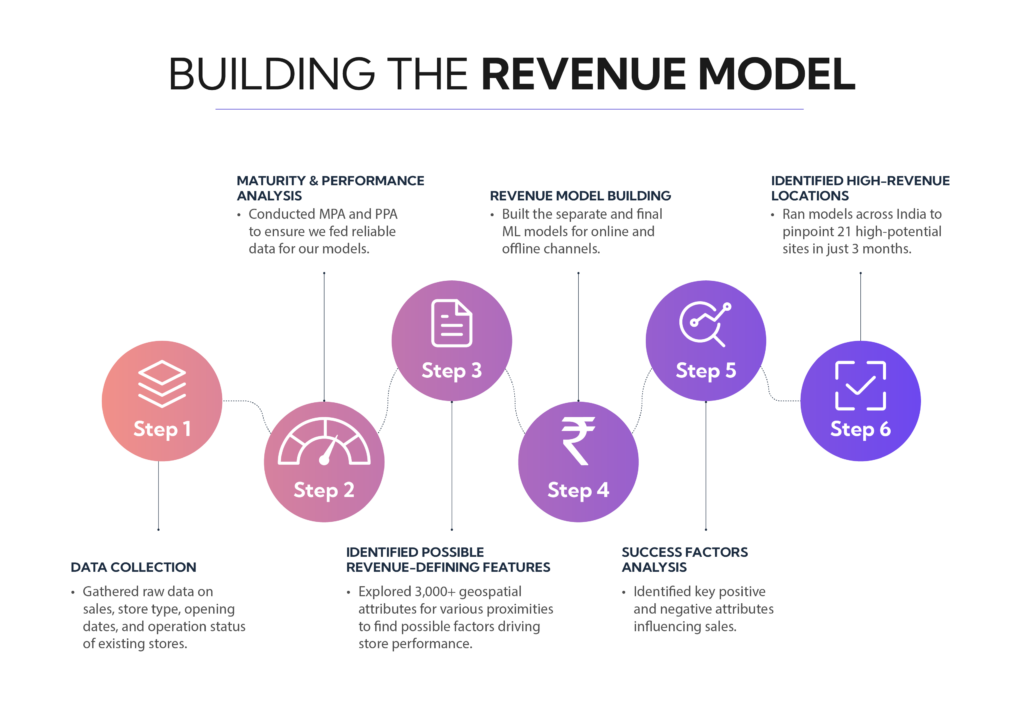
Now let’s discuss how we started building the model on a step-by-step basis.
Step 1: Store data collection
We worked with our client to gather data from their existing stores – 827 to be precise, across 167 cities which includes both operating and closed stores. The overall timeframe of the data we collected is 24 months.
The collected data includes various store specifications such as Store Code, Store Name, Store Ownership (COCO/FOFO), Store Opening Date, Store Type (Mall, Tech Park, High-Street), Store Size, Seating Capacity, Closing Date, and Reason for Closing.
To analyze how well the store performs in terms of sales, we’ve collected the number of In-store
Receipts, and the Number of Online Transaction Receipts.
These data were then sanity checked for accuracy, correctness, and quality to ensure there were no obvious errors, inconsistencies, or missing information on the data front.
Step 2: Conducting Maturity and Performance Period analysis
After ensuring the data was clean and well explored, we conducted the following analyses to assess its reliability:
- Maturity Period Analysis – to identify when a store’s sales stabilize after opening on average. We found that this typically happens within 6 months for both the channels. This ensures that we only train the model based on reliable, stable data.
- Performance Period Analysis – to reveal the patterns of sales consistency across both channels over a 12-month period. We’ve found that sales remain constant throughout this time, which ensures that the data we feed to the model reflects a store’s long-term success rather than taking temporary sales fluctuations into account.
Also, by analyzing these periods, we identified the range of data we can consider, ensuring that the model is trained using relevant and stable information.
Step 3: Identifying revenue-defining features (location characteristics)
Using the collected data, we explored all factors influencing daily transactions (both online and offline) with the help of our pre-built geospatial features,(such as the presence of branded restaurants, apparel stores, etc), totalling 3,000.
These features were then defined for various catchment proximities, ranging from as close as 100m and 500m to 15-minute drive times. By correlating these attributes with existing store sales data, the initial model we built was able to identify the possible reasons behind a store’s sales.
Step 4: Building the ML Model for Predicting Average Daily Transaction
Once we had ensured the reliability and identified the timeline we should consider for our data, we proceeded to build an ML model to predict average daily number of transactions.
Given the complexity and differences in sales patterns across various locations, we developed separate machine-learning models for different segments to achieve more accurate predictions.
To forecast transactions nationwide, we split the modelling approach into specific sales channels and location categories as outlined below:
- Online number of transactions: (Across India)
- Offline number of transactions:
- Malls.
- Metro Cities.
- Non-Metro Cities.
Step 5: Understanding the factors that contribute to success
We ran prediction models on different locations to identify areas that result in a higher daily number of transactions.
By analyzing the patterns of successful stores, the model identified which specific factors and attributes from the 3,000 variables influence the sales of a store for both online and offline channels.
We then selected key attributes of a location that affect the store both positively and negatively.
Step 6: Identifying locations with higher revenue potential
Using the insights gained from the previous steps, we moved forward with running the model across India and identifying locations that offer the highest potential for revenue generation.
By leveraging the variables and patterns identified through the machine learning models, we were able to pinpoint areas that exhibit higher revenue potential.
Below are the key defining attributes that directly influence sales:
Insights:
1) Online Sales
i) Top location Attributes that impact online sales positively:
| Location Attribute | Impact |
| Residential rent | 7% |
| Presence of large apartments | 7% |
| Presence of pizza joints | 6% |
| Footfall in fast food joints | 6% |
| Presence of dessert stores | 6% |
| Presence of gyms | 4% |
| Presence of hotels | 4% |
| Presence of fast-food joints | 4% |
| Commercial building area | 3% |
| Total building area | 3% |
| Presence of food delivery and takeaway restaurants | 3% |
| Households with income above 10L | 1% |
| Seating availability of the stores | 1% |
ii) Top 3 location Attributes that impact online sales negatively:
| Location Attribute | Impact |
| Footfall in nearby shopping complexes | 11% |
| Presence of stores in Tier 3 cities | 8% |
| Online delivery of local Indian cuisines | 7% |
| Presence of stores in the state – Gujarat | 6% |
| Presence of stores in the retail format – Malls | 5% |
| Presence of branded cinemas | 4% |
2) Offline sales in Malls
i) Location attributes that impact offline sales in malls positively:
| Location Attribute | Impact |
| Presence of branded apparel stores | 14% |
| Presence of branded cosmetic stores | 13% |
| Presence of burger joints | 10% |
| Number of active stores | 9% |
| Presence of branded restaurants | 8% |
| Presence of frontage in the stores | 7% |
| Presence of dessert shops | 5% |
| Presence of branded eyewear shops | 4% |
ii) Location attributes that impact offline sales in malls negatively:
| Location Attribute | Impact |
| Households with Income above 20L | 5% |
| Availability of online delivery of pizza | 11% |
| Presence of stores in the state, Uttar Pradesh | 14% |
3) Offline sales in high streets (Non-metro)
i) Location attributes that impact offline sales in metro high streets positively:
| Location Attribute | Impact |
| Presence of shopping complexes | 9% |
| Presence of store in the state – Punjab | 8% |
| Presence of high-end branded restaurants | 7% |
| Cost for two at cafes in the immediate surrounding | 7% |
| Presence of food delivery and takeaway restaurants | 7% |
| Presence of branded gyms | 6% |
| Area (sqft) of a store | 5% |
| Commercial building area in the vicinity | 4% |
| Presence of small apartments | 4% |
| Online sales of continental food | 3% |
| Presence of Italian restaurants | 1% |
ii) Location attributes that impact offline sales in metro high streets negatively:
| Location Attribute | Impact |
| Presence of South Indian restaurants | 10% |
| Presence of Company-owned Company Operated stores (COCO) | 10% |
| Presence of residential buildings | 10% |
| Commercial rent | 10% |
4) Offline sales in metro high street
i) Location attributes that impact offline sales in metro high streets positively:
| Location Attribute | Impact |
| Meal cost for two at North Indian restaurants | 12% |
| Commercial rent | 10% |
| Area of the store | 9% |
| Presence of branded restaurants | 9% |
| Presence of fast food joints | 8% |
| Cost for two at dessert restaurants | 8% |
| Footfall in nearby offices | 6% |
| Seating of the store | 5% |
| Cost for two – beverages | 5% |
ii) Location attributes that impact offline sales in metro high streets negatively:
| Location Attribute | Impact |
| Presence of beauty salons | 12% |
| Presence of biryani joints | 8% |
| Distance from secondary roads | 5% |
| Online delivery affluence for the pizza | 3% |
| Meal cost for two at Chinese restaurants | 1% |
These identified key location attributes that influence both online and offline sales, will help us pick the right locations for our client.
By understanding the positive and negative factors affecting sales in different regions—whether in malls, high streets, or metro/non-metro areas—we can identify prime locations with the highest revenue potential.
By applying these insights to future site selection, the client can strategically expand and maximize profitability across both channels.
Leveraging these valuable insights, GeoIQ enabled the brand to efficiently shortlist 50+ high-potential sites, ensuring profitability and sustained growth in the future!

